Frequently Asked Questions
Why does this dashboard focus on mines and rivers?
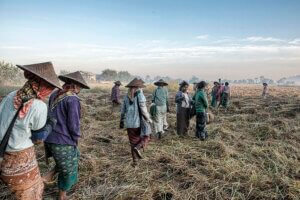
Many kinds of mining activity are traditionally conducted alongside or near rivers. Some forms of mining activity, such as gold mining, can occur directly on the river. In-situ leaching, the form of rare earth mining most common in Southeast Asia, uses large quantities of water pumped from nearby rivers to flush subsurface layers in the hills with water and chemicals to create a slurry that is later separated into rare earth minerals and waste material. At unregulated mine sites, the wastewater is diverted back to rivers and flows downstream. Wastewater can contain toxic metals and chemicals such as arsenic, mercury, cadmium, manganese, and other contaminants. These contaminants can then pollute local water supplies, floodplains used for agricultural production, and fish populations, among other impacts. High levels of these contaminants are known to cause severe health risks to those affected.
Mining activity in mainland Southeast Asia is proliferating at a rapid rate, and the impact of mining on local communities and aquatic life is mostly unknown and undocumented. Governments in the Mekong are either unprepared to address current and future impacts, or they are turning a blind eye to the problem. Impacts of mining in Myanmar’s Kachin State are coming to light after years of research and engagement from local and international NGOs. In Thailand’s Chiang Rai province, a looming health crisis is brewing from upstream mining in Myanmar on the Kok, Sai-Ruak, and Mekong Rivers. Media coverage of mining impacts in Chiang Rai started around April 2025, but much more work needs to be done to initiate an appropriate response from authorities in Thailand and Myanmar. Finally, mining activity in Laos and Cambodia is only recently being documented — some of it for the first time on this dashboard. A concerted effort composed of government authorities, regional organizations, NGOs, academics, and communities is required to develop a baseline of understanding of the impacts of mining activity. It is our hope that this dashboard can serve as a hub for data and information on the impact of mining activity on rivers.
How are mines identified?
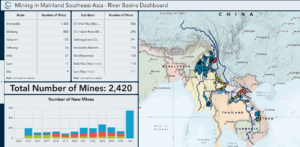
The Stimson Center uses Planet Labs imagery to identify, verify, and update locations of mining activities on or near rivers in mainland Southeast Asia. Some of the mining locations have been identified by other organizations and researchers who have published reports, maps, and/or mining location datasets. We also verify this data and give credit to the original source in the respective mine’s pop-up box. The footprint of mining activity — excavation sites, processing zones, tailing dams — is easily identified with optical satellite imagery. Mining activity for unique mineral resources has a unique footprint identifiable by optical imagery, which makes it possible to differentiate and categorize different types of mining activity. For example, mining for rare earth material in Southeast Asia is overwhelmingly done through in-situ leaching, a unique process that includes a deforested hillside and a corresponding downhill set of large pools, which is identifiable through high-resolution optical imagery. By switching to the satellite basemap on the dashboard, you can see some of the mining activity. However, this basemap is a default satellite basemap provided by Esri, and the imagery could be from one to five years ago. Download the mines dataset here.
What else is on the dashboard?
Rivers: The rivers displayed on the dashboard are only those segments potentially impacted by mining activity. The headwaters of these rivers are not displayed if mining activity is not located near the headwaters. Clicking on a segment of the river will display the river’s name and other descriptive information. Data: HydroSHEDS
Dams and reservoirs: The dashboard shows the location of large dams and their respective reservoirs located within the watersheds where mining occurs. Clicking on the dam icon (hydropower or water supply) will provide information about the dam and its reservoir. Rare earth elements and other metals and chemicals that are sent into rivers due to mining activities can damage operational components of dams such as turbines. The river’s flow slows as it enters a reservoir from the upstream, so heavy metals and chemical contaminants could settle at the bottom of the reservoir and possibly reduce downstream damage, but the degree to which this mitigates contamination will vary from reservoir to reservoir and is relatively understudied. Also, aquaculture farms and other activities are conducted on or around reservoirs, and higher concentrations of contaminants could cause damage to these activities. Data: Mekong Infrastructure Tracker (Stimson).
How can I use this dashboard and its information?
Nearly every feature of the dashboard — mining sites, rivers, dam locations, etc. — is clickable and has underlying information displayed in a pop-up window. The tables and charts are also interactive. For example, clicking on a river in the River Basin or River Sub-Basin table will only display mining sites in that river basin. The time series chart will also update to reflect when mines were developed in that basin over time. The blue bars on the time series are also clickable and interactive. To reset or return to a global view all mining activity, simply unclick your selection.
For a more centralized filter system, the pull-out sidebar has similar — and new — options for searching and filtering through the dataset, including year of operation, river basins and sub-basins, and country. Feel free to take screenshots of what you see on the dashboard. We only ask that you attribute your screenshots or data from this dashboard to the Stimson Center.
What data and information are coming soon?
Currently, the dashboard only displays information on rare earth mining activity. We are preparing data on other types of mining activity, including gold, gold and copper, gold and silver, potash, iron, limestone, and unidentified mines. We also plan to share water, soil, and sediment quality data published by relevant authorities on publicly available platforms. This data is often published in local languages, so this dashboard will unify water, soil, and sediment quality data in one language. We also plan to publish water, soil, and sediment quality data and pollution information published by qualified academic institutions and citizen science partners.
We are exploring additional health, social, and environmental indicators and welcome potential partners to contact Regan Kwan ([email protected]) regarding data partnerships and data contribution.
The changelog below will track new data as it is updated into the dashboard.
How can I learn more about the impacts of mining on rivers, people, and aquatic life?
The internet is populated with many resources on the impacts of mining on rivers, people, and aquatic life, in addition to other impacts. Here are a few recommended resources:
Web Article: Rare Earth Mines in Myanmar Are Poisoning Thai Rivers (The Diplomat, September 2, 2025)
Web Tutorial: Mining and Water Quality (USGS Water Science School, June 2018)
Video: What Republic of Congo’s Gold Rush is Leaving Behind (Mongabay, September 2025)
Academic Article: Toxicological Effects of Mining Hazard Elements (Energy Geoscience, July 2022)